
Reliability By The Numbers: Ably vs Pusher vs PubNub incident analysis
A Data-Driven Analysis of Realtime Platform Performance from Public Status Site Data
After the AWS outage, PubNub’s CEO posted a comment questioning Ably’s reliability reporting. Fair enough - extraordinary claims require extraordinary evidence.
So I pulled the data. All of it. Public. Verifiable. Objective.
I analysed 24 months of incident data from public status pages across Ably, PubNub, and Pusher - 133 incidents total, which is available in this Google Sheet.
The uptime vs. experience gap
When platforms claim “99.999% uptime,” they’re referring to SLA definitions that measure consecutive minutes of complete unavailability, excluding scheduled maintenance, brief errors, and degraded performance.
SLA uptime ≠ customer experience.
This analysis doesn’t calculate SLA uptime - that’s not measurable from status pages. Instead, it measures what customers actually experienced: every incident where status pages documented errors, failures, or material latency increases, regardless of SLA implications.
That’s the metric that matters. Here’s what the data shows:
Last 12 Months
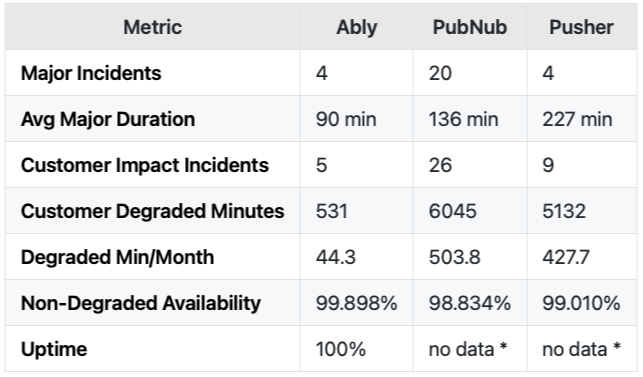
Ably demonstrated the strongest performance with 4 major incidents (avg 90 min duration) and 531 customer degraded minutes over 12 months.
PubNub had 5.0x more major incidents (20 vs 4), with an average major incident duration of 136 minutes. Customer degraded minutes totaled 6045 (11.4x more than Ably).
Pusher experienced 1.0x more major incidents (4 vs 4), with notably longer average durations at 227 minutes. Customer degraded minutes reached 5132 (9.7x more than Ably).
Last 24 Months
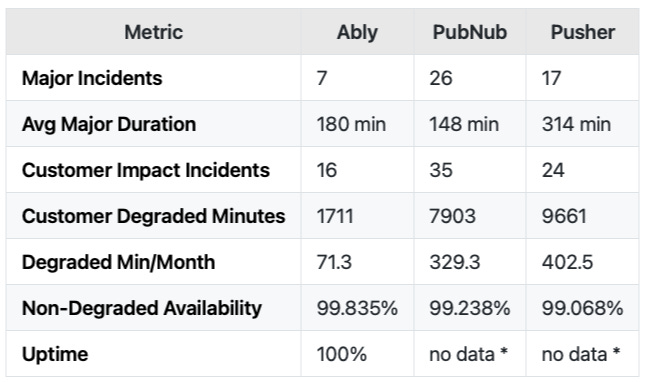
Ably demonstrated the strongest performance with 7 major incidents (avg 180 min duration) and 1711 customer degraded minutes over 24 months.
PubNub had 3.7x more major incidents (26 vs 7), with an average major incident duration of 148 minutes. Customer degraded minutes totalled 7903 (4.6x more than Ably).
Pusher experienced 2.4x more major incidents (17 vs 7), with notably longer average durations at 314 minutes. Customer degraded minutes reached 9661 (5.6x more than Ably).
Detailed Analysis (24 Months)
Over a 24-month period, 102 incidents were analysed across Ably, Pubnub, Pusher.
Key Findings (Customer-Impacting Degraded Service):
Ably: 16 customer impact incidents, 1711 total degraded minutes (28.5 hours)
PubNub: 35 customer impact incidents, 7903 total degraded minutes (131.7 hours)
Pusher: 24 customer impact incidents, 9661 total degraded minutes (161.0 hours)
Major Incident Summary:
Ably: 7 major incidents, average duration 180 minutes
PubNub: 26 major incidents, average duration 148 minutes
Pusher: 17 major incidents, average duration 314 minutes
Overall Statistics
Total Incidents by Platform
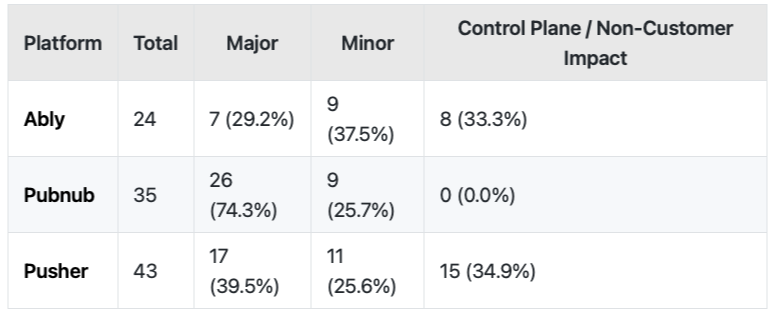
PubNub shows 74% of incidents classified as major compared to Ably’s 29%, indicating a higher proportion of severe customer-impacting issues.
Customer-Impacting Degraded Service Time
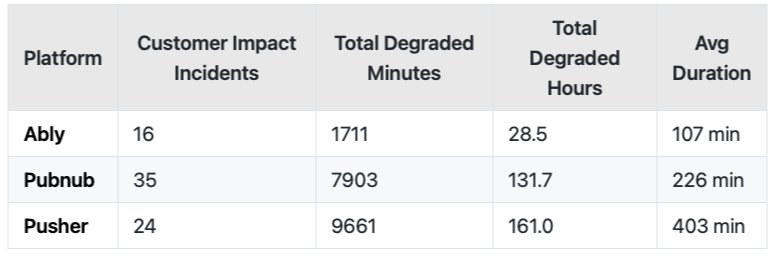
Pusher’s average incident duration of 314 minutes is significantly longer, contributing to 5.6x more total degraded service time compared to Ably.
Major Incident Duration Summary
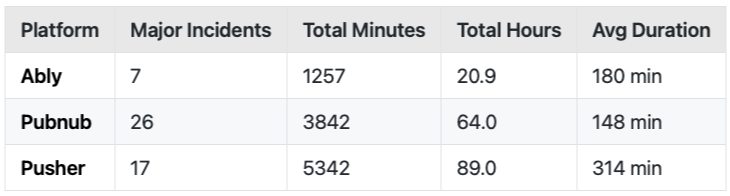
PubNub demonstrates the fastest average resolution time at 148 minutes, indicating more effective incident response and remediation processes.
Comparative Analysis
Monthly Averages
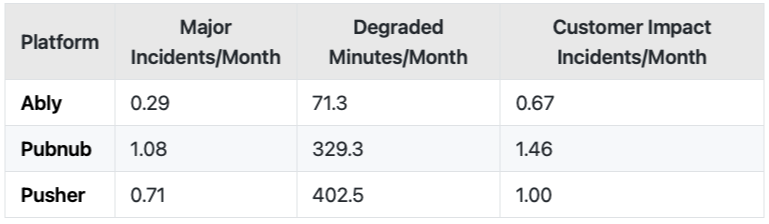
On a monthly basis, PubNub averages 4.6x more degraded service minutes than Ably, representing a consistent pattern of higher customer impact over the analysis period.
Methodology
Data Source
Platform: Statuspage.io public incident APIs
Period: 24 months (October 2023 - October 2025)
Incidents: 102 incidents analysed (133 total collected)
Classification
LLM-Based: Claude Sonnet analysed incident descriptions, timelines, and component impacts as data classification by vendors was not reliable
Categories: Major, Minor, Control Plane / Non-Customer Impact
Customer Impact: Separate tracking of customer-visible degradation
Timestamp Corrections: LLM corrected inaccurate timestamps by reading natural language in incident messages
Definitions
Incident Severity:
Major: Service failures, customer-visible errors, or extended periods of material latency increases
Minor: Brief degraded performance, short-duration issues, or transient errors
Control Plane / Non-Customer Impact: Internal/control plane issues OR incidents with no customer impact (dashboards, stats, documentation, billing, or internal issues handled gracefully)
Customer Impact:
Customer-Visible Errors: ANY errors that customers could see, even if brief
Material Latency: Significant slowdown mentioned in incident for extended periods
No Customer Impact: Control-plane issues, or internal issues handled gracefully (retries, failover) with no visible errors
Key Metrics:
Customer Degraded Service Time: Total minutes where customers experienced errors OR material latency
Non-Degraded Service Availability: 100% - (customer impact minutes / total minutes in period)
Major Incident Duration: Average length of major incidents, indicating how quickly issues are resolved
This report was generated from live data on 2025-10-29